Project Overview
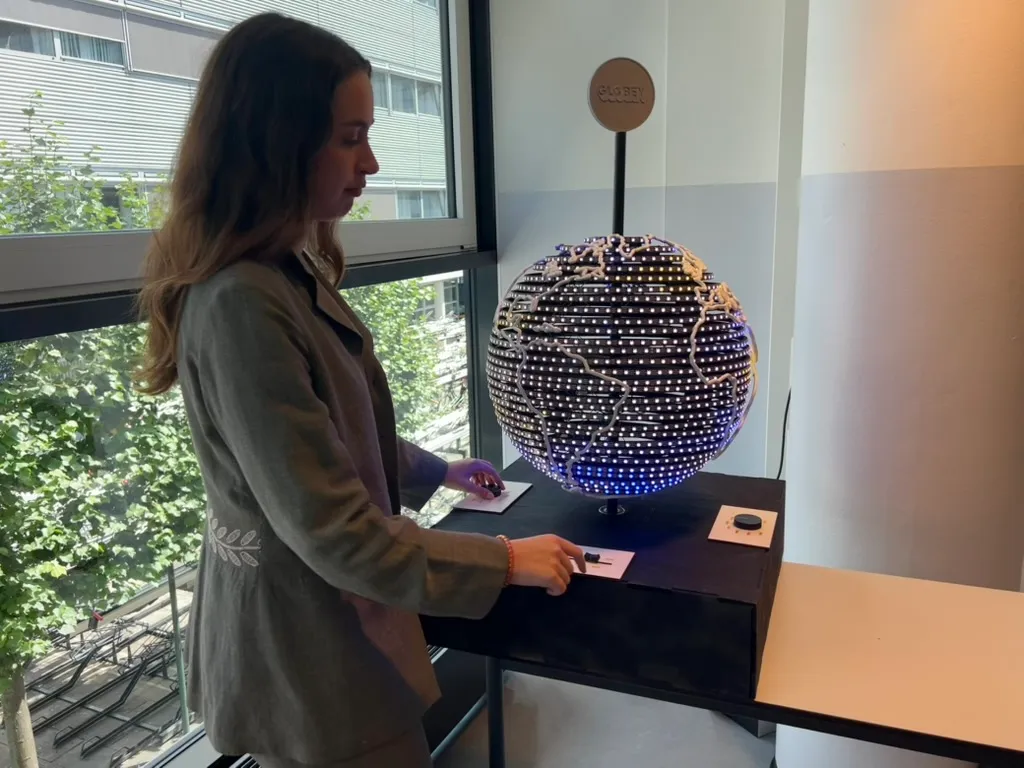
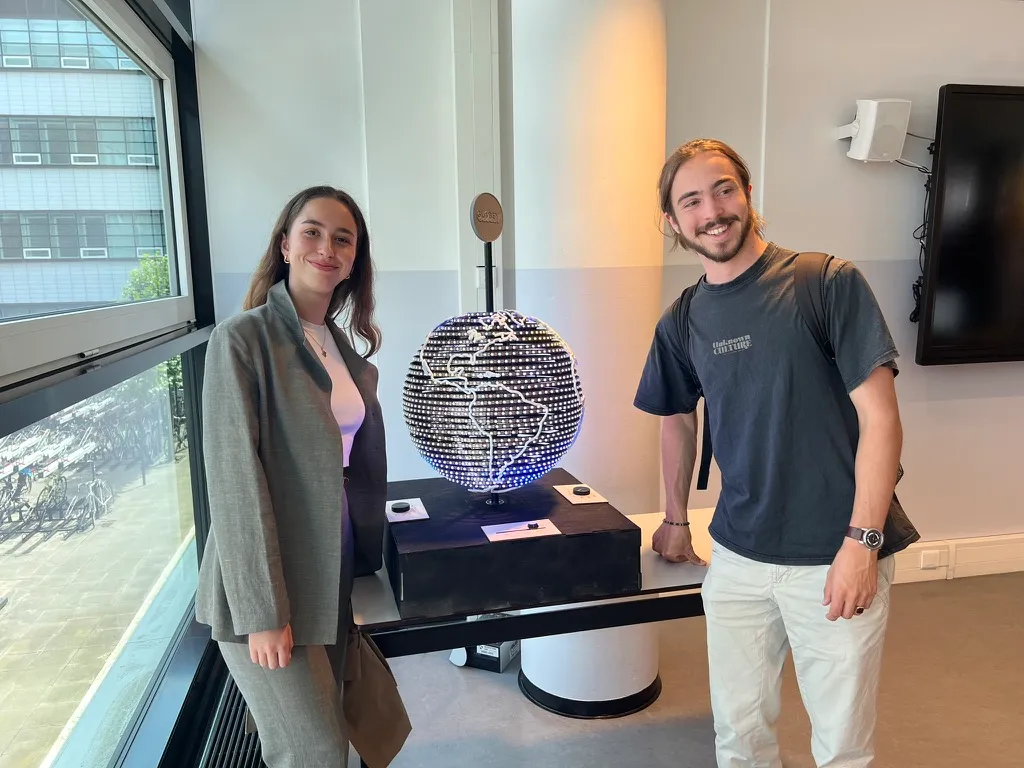
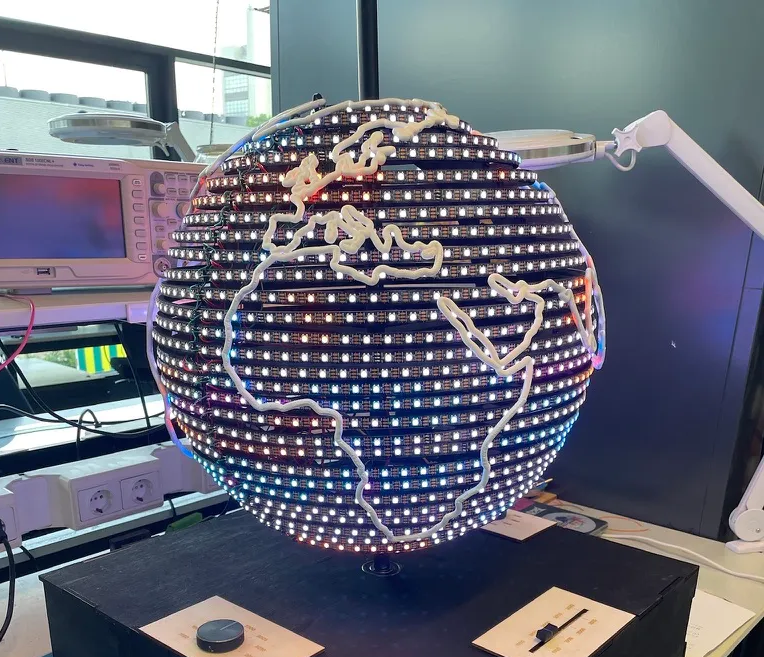
As my Creative Technology graduation thesis, I collaborated with a classmate, Luka van Hoeven to create Globey, an interactive data physicalization globe that visualizes climate change data. The globe uses LEDs to display temperature anomalies across decades, allowing users to explore global climate trends in an intuitive and tangible way.
Visitors could interact with the globe through a rotating mechanism, offering seamless 360-degree exploration. Knobs and sliders allowed users to select specific years, while the globe illuminated data on temperature anomalies, providing an engaging and educational experience.
The research for my thesis titled “Data Physicalization for Climate Change Data Using an Interactive Globe: Exploration of Input Modes for Time Series Data” (long title, I know) focused on exploring how different input methods influence user interaction with time-series data. I compared input modes such as sliders and knobs, assessing their impact on user engagement, efficiency, and satisfaction. While there was no statistical difference in efficiency or accuracy between the methods, users strongly preferred the tactile feedback of a clickable knob, describing it as more satisfying and enjoyable to use. You can read it here.
My Contributions
- Concept Design: Worked on how users would interact with the globe, ensuring the design was intuitive and engaging for exploring climate data. All decisions were carefully guided by research findings.
- Assembly and Wiring: Focused on designing and assembling the physical globe, creating a laser-cut skeleton and base to house the electronics. I integrated the LED system and handled the wiring.
- Research: Conducted a thorough literature review on data physicalization**, input modality effectiveness, satellite climate data, visualization of climate data, time series data, and related projects. Designed and ran user studies to compare different input methods, providing valuable insights into user interaction and preferences.
Impact
- The key findings of my research revealed valuable insights into interaction preferences, with tactile feedback proving to be highly appreciated.
- Strengthened my skills in interaction design, hardware assembly, and modular wiring, while gaining hands-on experience in turning complex satellite data into meaningful, tangible experiences.
- Presented and defended my thesis in front of a jury; and got a 9.2 as the final grade, proudly graduating with my Creative Technology bachelor’s degree!


